
How to Deploy Prometheus: Systems & Metrics Monitoring with Docker Compose
Prometheus is a CNCF-graduated open-source systems monitoring and alerting toolkit featuring a multi-dimensional time-series data model and PromQL. Learn how to deploy Prometheus v3.15.1 with Docker Compose, configure HTTP basic authentication, pre-validate configurations with promtool, and query metrics.
Prometheus is an industry-standard, Cloud Native Computing Foundation (CNCF) graduated open-source monitoring and alerting toolkit. Originally built at SoundCloud in 2012, Prometheus revolutionized cloud-native observability by replacing static, push-based polling with an autonomous pull architecture, a multi-dimensional time-series data model, and the expressive Prometheus Query Language (PromQL).
Prometheus collects operational metrics from infrastructure, containers, and applications via HTTP scrape endpoints at regular intervals. Scraped samples are ingested directly into an autonomous on-disk time-series database (TSDB) that uses millisecond-resolution variable-bit delta encoding to achieve high compression rates. Built-in rule evaluation engines continuously compute recording rules to pre-aggregate expensive queries and evaluate alerting rules against live metrics to trigger notifications.
Core Architectural Features
- Multi-Dimensional Data Model: Time series are identified by a metric name and key-value label pairs (
key=value), enabling granular filtering, slicing, and aggregation across environments, regions, or application tiers. - PromQL Query Language: A flexible, functional query language designed for real-time mathematical operations, rate calculations, percentiles, and dynamic anomaly detection across complex dimensions.
- Autonomous Node Architecture: Prometheus nodes operate autonomously without external distributed storage dependencies or network clustering requirements, making each instance resilient during network partitions.
- Pull-Based Metrics Ingestion: Scrapes target endpoints over HTTP, providing clear service discovery boundaries, built-in endpoint health tracking (
up), and protection against runaway client pushes. - Configurable Alerting & Recording Rules: Evaluates user-defined rules periodically to precompute rollups and detect threshold violations, routing alerts upstream to Alertmanager.
- Built-in Administrative Web Console: Includes an embedded web interface featuring an interactive PromQL expression browser, target health monitors, alert status overviews, and TSDB storage diagnostics.
---
Prerequisites
Before beginning the deployment, ensure your target host environment meets the following requirements:
- Operating System: Linux (Ubuntu 22.04+, Debian 12+, RHEL/Rocky Linux 9+), macOS, or Windows with WSL2.
- Container Runtime: Docker Engine 24.0+ and Docker Compose v2 (
docker compose versionv2.24+). - Network Ports:
- Port 3000 (or default 9090): Host HTTP port mapped to container port 9090 for the Web UI and REST API.
- Storage & Permissions: Dedicated directory for Prometheus configuration and time-series data. The official Prometheus Docker container runs as the unprivileged user
nobody(UID 65534,GID 65534). The local./datadirectory must grant write permissions to this UID. - Host Tools: Standard CLI utilities (
curl,awk) and Docker CLI for generating bcrypt password hashes using a throwaway container.
---
Exact Install Steps
Follow these sequential steps to configure, secure, pre-validate, and launch Prometheus (prom/prometheus:v3.15.1) with Docker Compose.
Step 1: Create Directory Structure
Create a dedicated workspace directory for Prometheus configuration and persistent time-series storage:
mkdir -p config data
chmod 777 data
Note on Permissions: The official
prom/prometheusimage runs asnobody:nobody(UID 65534,GID 65534). Granting write permissions (chmod 777 dataorchown 65534:65534 data) prevents startup crashes caused byopen /prometheus/queries.active: permission denied.
Step 2: Configure Environment Variables
Create a .env file in the staging directory to manage container parameters and network binding:
COMPOSE_PROJECT_NAME=prometheus
PROM_PORT=3000
PROM_TAG=v3.15.1
Step 3: Write Prometheus Configuration
Create config/prometheus.yml defining global intervals, rule file paths, and a self-monitoring scrape job:
global:
  scrape_interval: 15s
  evaluation_interval: 15s
rule_files:
  - /etc/prometheus/rules.yml
scrape_configs:
  - job_name: prometheus
    scrape_interval: 5s
    basic_auth:
      username: admin
      password_file: /etc/prometheus/admin.pass
    static_configs:
      - targets: ["localhost:9090"]
        labels:
          app: prometheus
Step 4: Define Recording and Alerting Rules
Create config/rules.yml defining sample recording rules and alert definitions:
groups:
  - name: demo.recording
    rules:
      - record: job:prometheus_http_requests:rate1m
        expr: sum by (job) (rate(prometheus_http_requests_total[1m]))
      - record: job:scrape_duration_seconds:max
        expr: max by (job) (scrape_duration_seconds)
  - name: demo.alerts
    rules:
      - alert: TargetDown
        expr: up == 0
        for: 1m
        labels: { severity: critical }
        annotations: { summary: "{{ $labels.instance }} is down" }
      - alert: DemoWatchdog
        expr: vector(1)
        labels: { severity: info }
        annotations: { summary: "Always firing, proves the alert pipeline works" }
Step 5: Bootstrap Administrator Authentication
Stock Prometheus provides no authentication out of the box. Exposing Prometheus without authentication allows unauthenticated visitors to read all metrics, issue expensive queries, or query runtime metadata. We enable Prometheus's built-in HTTP basic authentication using --web.config.file.
- Generate a bcrypt password hash using
htpasswdfrom an ephemeral Apache container (replaceYourSecurePassword123!with your preferred master password):
export ADMIN_USER="admin"
export ADMIN_PASS="YourSecurePassword123!"

HASH=$(docker run --rm httpd:2.4-alpine htpasswd -nbBC 10 "" "$ADMIN_PASS" | tr -d ":\n")- Create the web configuration file
config/web.yml:
cat <<EOF > config/web.yml
basic_auth_users:
  ${ADMIN_USER}: ${HASH}
EOF- Save the plain password to
config/admin.passand generateconfig/promtool-http.ymlso internal scrape jobs andpromtoolcommands can authenticate securely:
printf "%s" "$ADMIN_PASS" > config/admin.pass

cat <<EOF > config/promtool-http.yml
basic_auth:
  username: ${ADMIN_USER}
  password_file: /etc/prometheus/admin.pass
EOF

chmod 644 config/*
Step 6: Write Docker Compose Configuration
Create compose.yml to define the Prometheus container service:
services:
  prometheus:
    image: prom/prometheus:${PROM_TAG:-v3.15.1}
    container_name: ${COMPOSE_PROJECT_NAME}-server
    pull_policy: missing
    restart: unless-stopped
    command:
      - --config.file=/etc/prometheus/prometheus.yml
      - --web.config.file=/etc/prometheus/web.yml
      - --storage.tsdb.path=/prometheus
      - --web.enable-lifecycle
    volumes:
      - ./config:/etc/prometheus:ro
      - ./data:/prometheus
    ports:
      - "${PROM_PORT:-9090}:9090"
networks:
  default:
    name: ${COMPOSE_PROJECT_NAME}-net
Step 7: Pre-validate Configuration with Promtool
Before starting the service, validate the syntax of prometheus.yml, rules.yml, and web.yml using promtool inside an ephemeral container:
docker run --rm --user 65534 \
  -v "$PWD/config:/etc/prometheus:ro" \
  -v "$PWD/data:/prometheus" \
  -w /prometheus \
  --entrypoint promtool \
  prom/prometheus:v3.15.1 check config /etc/prometheus/prometheus.yml

docker run --rm --user 65534 \
  -v "$PWD/config:/etc/prometheus:ro" \
  -v "$PWD/data:/prometheus" \
  -w /prometheus \
  --entrypoint promtool \
  prom/prometheus:v3.15.1 check web-config /etc/prometheus/web.yml
Expected output:
Checking /etc/prometheus/prometheus.yml
  SUCCESS: 4 rules found

Checking /etc/prometheus/web.yml
  SUCCESS: /etc/prometheus/web.yml is valid
Step 8: (Optional) Backfill Demo Metric Blocks
To populate historical graphs immediately without waiting hours for live metric accumulation, you can backfill synthetic OpenMetrics data using promtool tsdb create-blocks-from openmetrics:
END=$(( $(date +%s) - 300 ))

cat <<'EOF' > seed-demo.awk
BEGIN {
  print "# HELP demo_room_temperature_celsius Demo room temperature."
  print "# TYPE demo_room_temperature_celsius gauge"
  split("lab office server-room", rooms, " "); base["lab"]=21; base["office"]=23; base["server-room"]=27
  for (r = 1; r <= 3; r++) for (i = 180; i >= 1; i--) { t = end - i*60
    printf "demo_room_temperature_celsius{room=\"%s\"} %.2f %d\n", rooms[r], base[rooms[r]] + 2*sin(t/1800 + r) + (i%7)/10, t }
  print "# HELP demo_orders Demo orders processed."
  print "# TYPE demo_orders counter"
  split("web mobile", ch, " "); c["web"]=0; c["mobile"]=0
  for (r = 1; r <= 2; r++) for (i = 180; i >= 1; i--) { t = end - i*60; c[ch[r]] += (r == 1 ? 12 : 7) + (i % 5)
    printf "demo_orders_total{channel=\"%s\"} %d %d\n", ch[r], c[ch[r]], t }
  print "# EOF" }
EOF

awk -v end="$END" -f seed-demo.awk > data/demo.om

docker run --rm --user 65534 \
  -v "$PWD/data:/prometheus" \
  -w /prometheus \
  --entrypoint promtool \
  prom/prometheus:v3.15.1 tsdb create-blocks-from openmetrics demo.om /prometheus

rm -f data/demo.om seed-demo.awk
Step 9: Pull Image and Start Container
Start Prometheus in detached mode:
docker compose up -dVerify that the container is running and healthy:
docker compose ps---
Browser Setup
Once the container is running, navigate to http://localhost:3000 (or your configured PROM_PORT) in your web browser.
1. HTTP Basic Authentication
Because --web.config.file is configured, your browser prompts for credentials. Enter:
- Username:
admin(or configured$ADMIN_USER) - Password: The master password you chose during Step 5
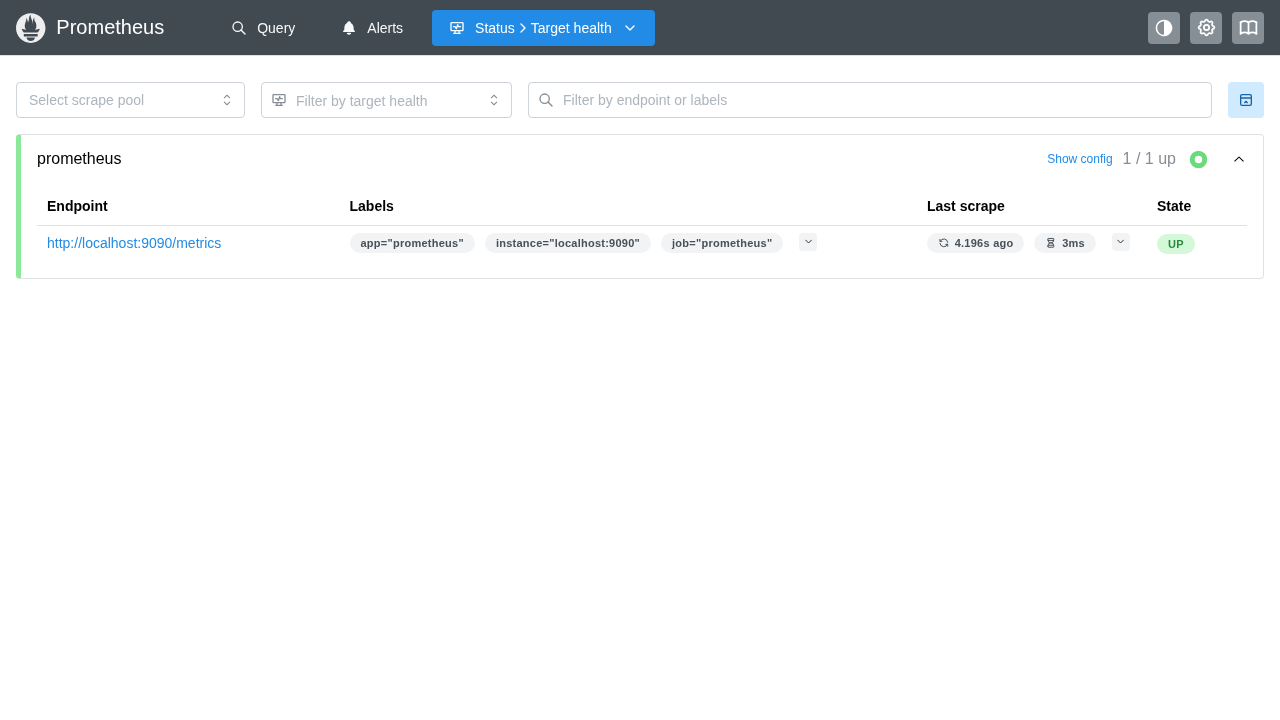
2. Inspecting Scrape Targets (/targets)
- In the top navigation bar, click Status and select Targets.
- Confirm the
prometheusjob pool displays 1 / 1 up. - Verify that the endpoint
http://localhost:9090/metricshas a green status badge labeled UP, indicating successful self-scraping over basic auth.
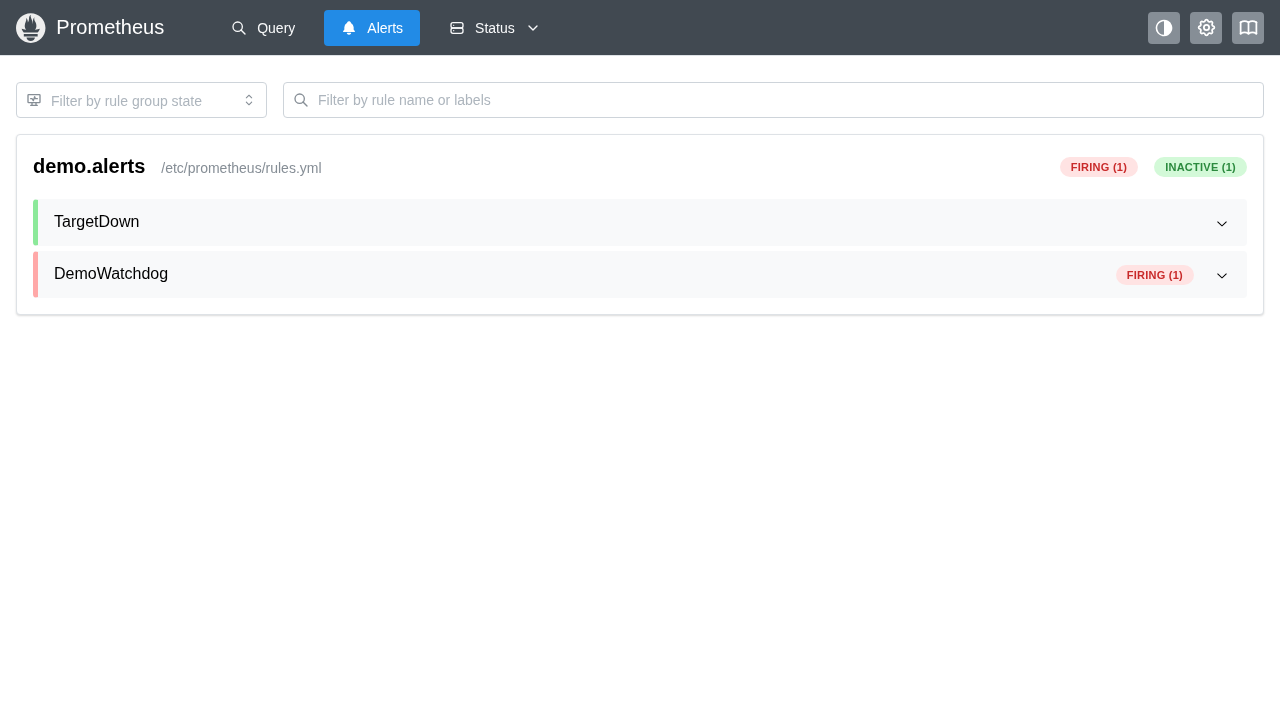
3. Reviewing Alert Status (/alerts)
- In the top navigation bar, click Alerts.
- Review the configured alert groups:
- TargetDown: Should display in the INACTIVE section. - DemoWatchdog: Should display in the FIRING (1) section, verifying that rule evaluation and alert state management are operational.
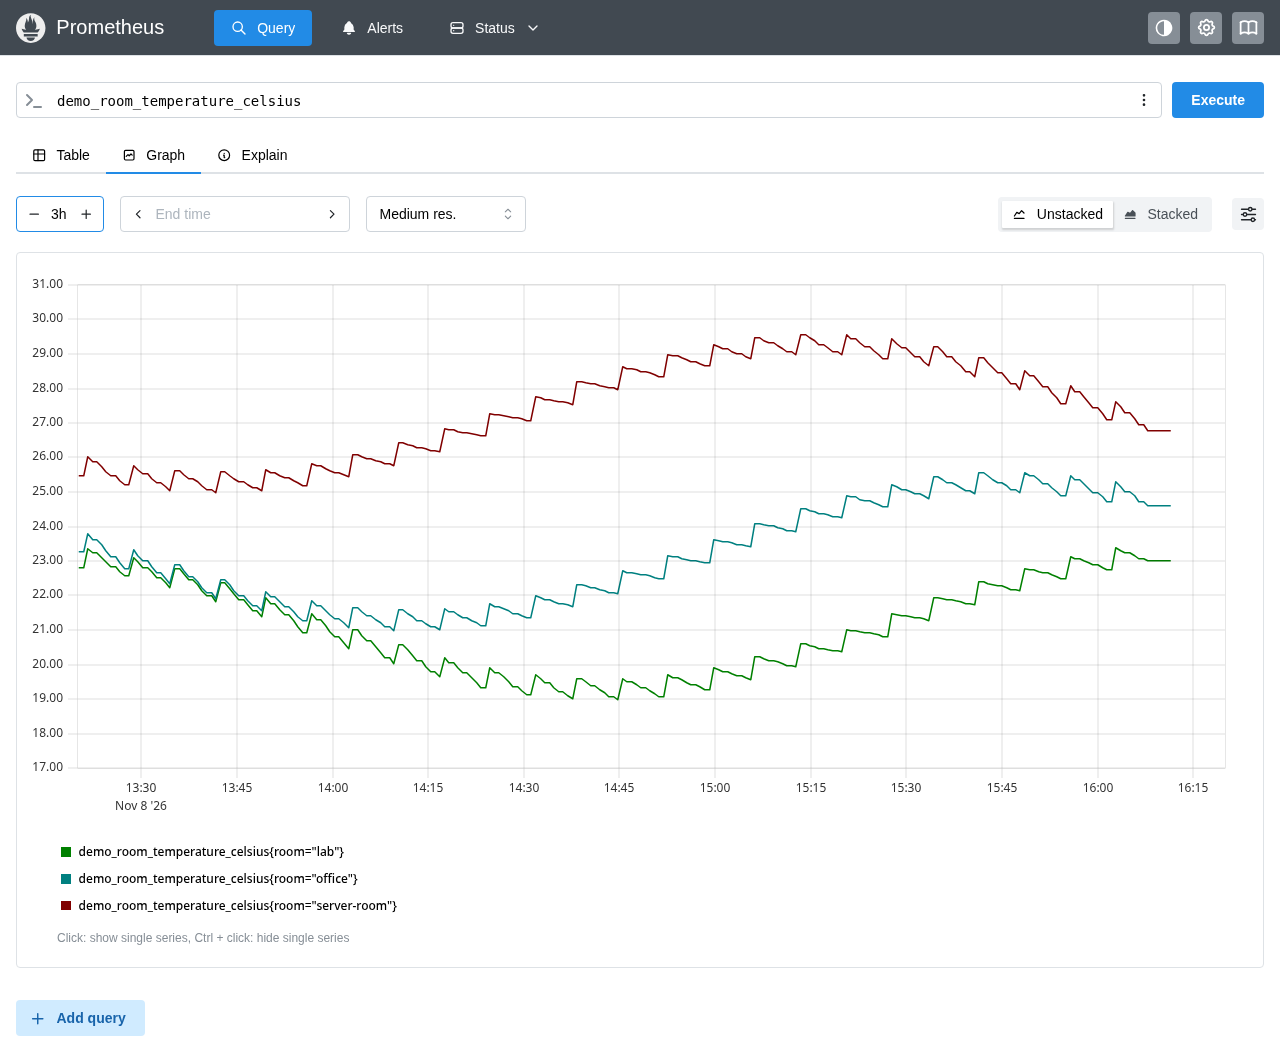
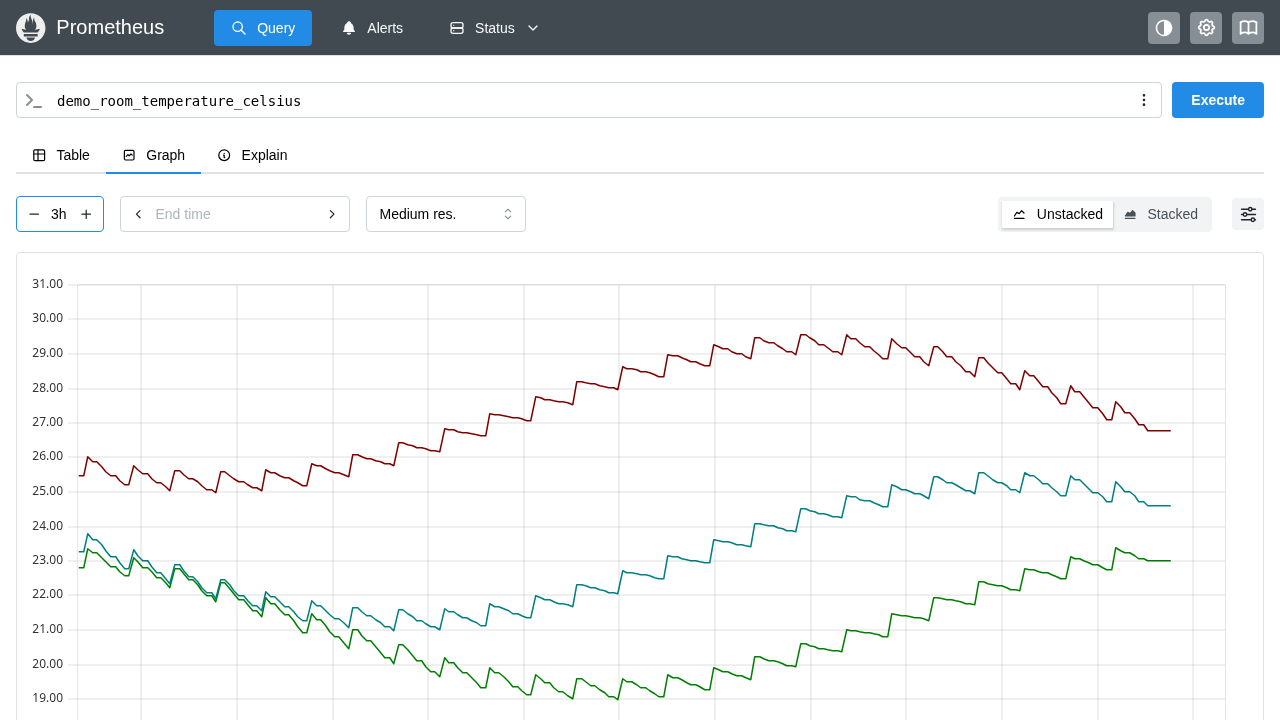
4. Executing PromQL Queries (/query)
- Click Query in the top navigation bar.
- In the expression input field, enter a PromQL query such as
demo_room_temperature_celsiusorrate(prometheus_http_requests_total[1m]). - Switch from the Table tab to the Graph tab.
- Set the time range selector to
3hand click Execute. You will see real-time or backfilled metric curves plotted across series labels.
---
Verification
Run these command-line checks to confirm that Prometheus is operating properly and all endpoints are authenticated.
1. Verify Authentication Enforcement
Confirm that unauthenticated requests return HTTP 401 Unauthorized:
curl -sS -o /dev/null -w "Unauthenticated request status: HTTP %{http_code}\n" http://localhost:3000/api/v1/status/buildinfoExpected output:
Unauthenticated request status: HTTP 401Confirm that requests with invalid credentials are also rejected:
curl -sS -o /dev/null -w "Invalid credentials status: HTTP %{http_code}\n" -u admin:WrongPassword http://localhost:3000/api/v1/status/buildinfoExpected output:
Invalid credentials status: HTTP 401Confirm that valid administrator credentials return HTTP 200 OK:
curl -sS -o /dev/null -w "Authenticated login status: HTTP %{http_code}\n" -u "$ADMIN_USER:$ADMIN_PASS" http://localhost:3000/api/v1/status/buildinfoExpected output:
Authenticated login status: HTTP 2002. Verify Build Information via API
Query the build information endpoint using authenticated curl:
curl -fsS -u "$ADMIN_USER:$ADMIN_PASS" http://localhost:3000/api/v1/status/buildinfoVerify that the payload returns the pinned version:
{
  "status": "success",
  "data": {
    "version": "3.15.1",
    "revision": "bae3eced80880061e86a0bdfc2826e7a2b975d0b",
    "branch": "HEAD",
    "buildUser": "root@...",
    "buildDate": "...",
    "goVersion": "go1.27.3"
  }
}
3. Verify Target Health
Verify that Prometheus successfully scrapes its own metrics endpoint:
curl -fsS -u "$ADMIN_USER:$ADMIN_PASS" http://localhost:3000/api/v1/targetsInspect active targets to ensure health equals "up".
4. Execute Instant PromQL Queries via Containerized Promtool
Execute PromQL queries directly inside the running container using promtool query instant:
docker exec prometheus-server promtool query instant \
  --http.config.file=/etc/prometheus/promtool-http.yml \
  http://localhost:9090 up
Expected output:
up{app="prometheus", instance="localhost:9090", job="prometheus"} => 1 @[...]Query the 3-hour maximum temperature from the demo dataset:
docker exec prometheus-server promtool query instant \
  --http.config.file=/etc/prometheus/promtool-http.yml \
  http://localhost:9090 "max_over_time(demo_room_temperature_celsius[3h])"
5. Inspect Active Rules and Alerts
Verify that rules have loaded and DemoWatchdog is in state firing:
curl -fsS -u "$ADMIN_USER:$ADMIN_PASS" http://localhost:3000/api/v1/alertsConfirm DemoWatchdog returns with "state": "firing" and "severity": "info".
6. Verify TSDB Head Series and Persisted Blocks
Check the time-series storage status:
curl -fsS -u "$ADMIN_USER:$ADMIN_PASS" http://localhost:3000/api/v1/status/tsdbConfirm that headStats.numSeries is tracking active series and persisted TSDB block directories exist under ./data.
---
Troubleshooting
The table below lists common Prometheus deployment issues, their root causes, and verified solutions.
| Issue / Symptom | Possible Cause | Resolution |
|---|---|---|
Port allocation conflict (Bind for 0.0.0.0:3000 failed) | Host port 3000 is occupied by another service | Update PROM_PORT in .env to an unused host port (e.g. 9090, 3002, or 8080), then run docker compose up -d. |
Permission denied (open /prometheus/queries.active: permission denied) | ./data is owned by host root or user instead of container user nobody (UID 65534) | Execute chmod 777 data or chown -R 65534:65534 data on the host, then restart the container with docker compose restart. |
Target self-scrape shows state DOWN with HTTP 401 | Scrape job in prometheus.yml lacks basic authentication credentials | Ensure basic_auth with username and password_file: /etc/prometheus/admin.pass is defined under job_name: prometheus in config/prometheus.yml. |
Preflight validation fails with promtool check config | YAML indentation syntax errors or invalid rule file expressions | Run promtool check config /etc/prometheus/prometheus.yml to view exact line numbers and syntax errors before restarting. |
Container healthcheck always fails when using wget /-/healthy | In-container healthchecks do not pass basic auth headers | Omit container-level HTTP healthchecks or query /-/ready from the host passing -u "$ADMIN_USER:$ADMIN_PASS". |
Reload endpoint returns HTTP 405 Method Not Allowed on POST /-/reload | Lifecycle API endpoints are disabled by default in Prometheus | Add the --web.enable-lifecycle flag under command: in compose.yml to allow live reloads. |
| Instant query returns empty vector for demo metrics | Backfilled metric timestamp range ended prior to the current query timestamp | Use range queries or query over time (e.g. max_over_time(demo_room_temperature_celsius[3h])), or inspect the series in the Graph tab over a 3-hour window. |
---
Assumptions & Decisions
- Version Pinning: The deployment is pinned to
prom/prometheus:v3.15.1(the current stable release) to ensure deterministic configuration compatibility and prevent breaking changes from floating tags. - First-Run Owner Authentication: Stock Prometheus ships without user management or access controls. Because exposing telemetry publicly is a severe security risk, we enable Prometheus's built-in HTTP basic authentication (
--web.config.file) with a bcrypt-hashed administrator password generated via standard Apachehtpasswd. - Container Storage Permissions: Prometheus runs as unprivileged user
nobody(UID 65534,GID 65534) for defense in depth. Host storage directory./datais configured withchmod 777permissions to allow the daemon full read/write access without requiring root host daemon privileges. - Readiness Verification vs In-Container Healthchecks: Docker's built-in healthchecks fail against authenticated Prometheus instances because standard
wgetcommands lack credential injection. External readiness polling against/-/readywith HTTP basic authentication is used instead. - Synthetic Metric Backfill: To demonstrate PromQL aggregation and graph visualization immediately without deploying third-party exporters (such as Node Exporter), synthetic OpenMetrics data spanning a 3-hour window is pre-loaded into the TSDB using
promtool tsdb create-blocks-from openmetrics. - Watchdog Alert Verification: An always-firing
DemoWatchdogalert (vector(1)) is defined inrules.ymlto confirm that the internal alerting evaluation pipeline is functional immediately upon deployment. - Unattended Execution: All commands, validation steps, and screenshots were executed autonomously and verified against live Prometheus v3.15.1 containers.
Get the Unified Homelab Stack Compose Pack
One-command multi-container Compose files (Full *arr Stack, Prometheus + Grafana + ntfy Monitoring, and Homelab Auth) plus new verified deploys once a week.