
How to Deploy Grafana: Telemetry Dashboards & Visualization with Docker Compose
Grafana is the leading open-source platform for querying, visualizing, and alerting on multi-source metrics, logs, and traces. Learn how to deploy Grafana 13.3.0 with Docker Compose, bootstrap administrator security via the CLI, configure automated API tokens, and visualize synthetic telemetry with built-in TestData.
Grafana is the industry-standard, multi-platform open-source visualization, dashboarding, and operational observability platform. Created by Torkel Ödegaard in 2014 and licensed under AGPL-3.0, Grafana empowers systems engineers, DevOps teams, and homelab builders to query, visualize, alert on, and understand telemetry data across heterogeneous storage backends without locking users into a proprietary vendor silo.
Unlike tightly-coupled monitoring systems that force storage and visualization into a single monolith, Grafana operates on a composable, pluggable architecture. It acts as an operational single pane of glass, connecting seamlessly to time-series databases, log aggregators, tracing engines, and SQL stores while providing dynamic visualization panels, mathematical aggregations, and alerting pipelines.
Core Architectural Features
- Composable Data Source Architecture: Decouples data storage from visualization. Native plugins ingest metrics, logs, and traces from Prometheus, Loki, Tempo, InfluxDB, PostgreSQL, MySQL, Elasticsearch, OpenSearch, AWS CloudWatch, and Google Cloud Monitoring.
- Built-in TestData Data Source: Ships with an embedded synthetic telemetry engine (
grafana-testdata-datasource). This enables instant dashboard development, mathematical modeling, and automated UI testing (random walks, predictable CSV waves, streaming sine curves) without requiring external databases or exporters. - Rich Visualization Catalog: Provides high-performance visualization panels powered by uPlot and web canvases, including Time Series graphs, Stat cards with sparklines, Gauges, Bar Charts, Heatmaps, Geomaps, Node Graphs, and Canvas drawings with millisecond scrubbing.
- Explore Mode & Telemetry Correlation: A dedicated ad-hoc analytical workspace enabling engineers to split screens, execute cross-source queries, correlate logs directly alongside metrics spikes, and inspect raw payloads without modifying saved dashboards.
- Unified Alerting Engine: Combines alerting rules across disparate data sources into a centralized state machine that evaluates thresholds, manages mute timings, routes notifications through notification policies, and triggers alerts via Slack, PagerDuty, Discord, or Webhooks.
- Programmatic REST API & Service Accounts: Comprehensive HTTP REST APIs govern organizations, users, service accounts, automated API tokens, folders, datasources, and dashboards as code.
---
Prerequisites
Before deploying Grafana, ensure your host environment meets the following specifications:
- Operating System: Linux (Ubuntu 22.04+, Debian 12+, RHEL/Rocky Linux 9+), macOS, or Windows with WSL2.
- Container Runtime: Docker Engine 24.0+ and Docker Compose v2 (
docker compose versionv2.24+). - Network Ports: Host port 3000 (Grafana's default web UI and REST API port). If port 3000 is occupied, you can map any free host port (e.g.,
3002,3003, or8080) to container port3000. - Storage & File Permissions: Dedicated host directory for persistent SQLite database files (
grafana.db) and installed plugins. The official container executes as unprivileged usergrafana(UID 472, GID 472). The host data mount must be writable by UID 472. - Host Tools: Standard CLI utilities (
curl,awk,ss,python3for JSON formatting).
---
Exact Install Steps
Follow these sequential steps to configure, deploy, bootstrap, secure, and seed Grafana (grafana/grafana:13.3.0) using Docker Compose.
Step 1: Create Deployment Workspace and Configure Permissions
Create an isolated directory for the Grafana deployment and create the persistent data directory:
mkdir -p deploy/data
chmod 777 deploy/data
cd deploy
Permission Notice: The official Grafana container runs as
grafana:grafana(UID 472,GID 472). Granting write permissions (chmod 777 deploy/dataorchown -R 472:472 deploy/data) ensures the container process can create and migrate SQLite database tables upon initial boot.
Step 2: Configure Environment Variables
Create an environment configuration file (.env) to declare the Compose project namespace, pinned image tag, and host port binding:
cat > .env <<EOF
COMPOSE_PROJECT_NAME=grafana-stack
GRAFANA_PORT=3000
GRAFANA_TAG=13.3.0
EOF
Step 3: Write Docker Compose Configuration
Create compose.yml declaring the Grafana service with persistent volume mounts, resource configuration, disabled telemetry, and native container health checks:
cat > compose.yml <<'EOF'
services:
  grafana:
    image: grafana/grafana:${GRAFANA_TAG:-13.3.0}
    container_name: ${COMPOSE_PROJECT_NAME}-server
    pull_policy: missing
    restart: unless-stopped
    ports:
      - "${GRAFANA_PORT:-3000}:3000"
    environment:
      GF_USERS_ALLOW_SIGN_UP: "false"
      GF_AUTH_ANONYMOUS_ENABLED: "false"
      GF_ANALYTICS_REPORTING_ENABLED: "false"
      GF_ANALYTICS_CHECK_FOR_UPDATES: "false"
      GF_NEWS_NEWS_FEED_ENABLED: "false"
    volumes:
      - ./data:/var/lib/grafana
    healthcheck:
      test: ["CMD-SHELL", "wget -q --spider http://localhost:3000/api/health || exit 1"]
      interval: 5s
      timeout: 3s
      retries: 30
networks:
  default:
    name: ${COMPOSE_PROJECT_NAME}-net
EOF
Security Note: Anonymous access stays off, so every visitor has to sign in. The recorded demo turned on anonymous Admin only so the headless browser capture could skip the login form. Never do that on a Grafana instance other people can reach: anyone on your network would get full admin rights.
Step 4: Launch the Container Stack
Start the Grafana container in detached mode and poll the health check endpoint until the internal SQLite database migration completes:
docker compose up -d

# Wait for Grafana to initialize database tables and report healthy
for i in $(seq 1 60); do
  if curl -fsS "http://localhost:${GRAFANA_PORT:-3000}/api/health" 2>/dev/null | grep -q '"database": *"ok"'; then
    echo "Grafana initialized successfully."
    break
  fi
  sleep 1
done
Verify the endpoint status directly:
curl -fsS "http://localhost:${GRAFANA_PORT:-3000}/api/health"Expected output:
{
  "commit": "6f8ce3c6218fcebe2ea9edfe260c6d70ffb076ad",
  "database": "ok",
  "version": "13.3.0"
}
Step 5: Define the In-Container Operator CLI
Grafana bundles a management binary (grafana cli) inside the official image. Create a shell wrapper function G to invoke it directly inside the running container without polluting your host:
G() {
  docker exec ${COMPOSE_PROJECT_NAME:-grafana-stack}-server grafana cli --homepath /usr/share/grafana "$@"
}
Verify that the CLI functions and check installed plugins:
G --version
G plugins ls
Step 6: Bootstrap Administrator Authentication
Stock Grafana initialises with the well-known default credential pair admin / admin. Leaving default credentials active is a critical vulnerability. Rotate the administrator password immediately using the operator CLI:
export ADMIN_USER="admin"
export ADMIN_PASS="GrafDemo123!"

G admin reset-admin-password "$ADMIN_PASS"
Expected output:
Admin password changed successfully ✔Step 7: Validate Authentication Boundaries
Confirm that the old default password (admin / admin) and arbitrary invalid credentials return HTTP 401 Unauthorized, while the updated password authenticates successfully:
# Verify old default is rejected
curl -sS -o /dev/null -w "Default credentials: HTTP %{http_code}\n" -u admin:admin "http://localhost:3000/api/user"

# Verify wrong credentials are rejected
curl -sS -o /dev/null -w "Invalid credentials: HTTP %{http_code}\n" -u admin:wrong "http://localhost:3000/api/user"

# Verify rotated password succeeds
curl -sS -o /dev/null -w "Admin credentials:   HTTP %{http_code}\n" -u "$ADMIN_USER:$ADMIN_PASS" "http://localhost:3000/api/user"
Expected output:
Default credentials: HTTP 401
Invalid credentials: HTTP 401
Admin credentials:   HTTP 200
Verify session cookie creation via the /login endpoint:
curl -sS -c cookies.txt -H "Content-Type: application/json" \
  -d "{\"user\":\"$ADMIN_USER\",\"password\":\"$ADMIN_PASS\"}" \
  "http://localhost:3000/login"
Expected output:
{"message":"Logged in","redirectUrl":"/"}Clean up temporary session artifacts:
rm -f cookies.txtStep 8: Create Service Account and Bearer API Token
For CI/CD pipelines, automated provisioners, or infrastructure scripts, avoid sharing password credentials. Generate a dedicated Service Account and scoped API Token:
# Helper function for authenticated API requests
API() {
  curl -fsS -u "$ADMIN_USER:$ADMIN_PASS" -H "Content-Type: application/json" "http://localhost:3000$1" "${@:2}"
}

# Create Service Account
SA_ID=$(API /api/serviceaccounts -X POST -d '{"name":"shortform-bot","role":"Admin"}' | python3 -c 'import sys,json; print(json.load(sys.stdin)["id"])')

echo "Service Account ID: $SA_ID"

# Generate API Token
TOKEN=$(API /api/serviceaccounts/$SA_ID/tokens -X POST -d '{"name":"demo-token"}' | python3 -c 'import sys,json; print(json.load(sys.stdin)["key"])')

echo "Bearer Token: ${TOKEN:0:5}...<redacted>"
Create a Bearer token helper TAPI and verify token authorization:
TAPI() {
  curl -fsS -H "Authorization: Bearer $TOKEN" -H "Content-Type: application/json" "http://localhost:3000$1" "${@:2}"
}

TAPI /api/org
Expected output:
{"id":1,"name":"Main Org."}Step 9: Seed TestData Data Source and Live Dashboard
To enable immediate visual verification without configuring external databases, register the built-in synthetic TestData data source:
TAPI /api/datasources -X POST -d '{
  "name": "TestData",
  "type": "grafana-testdata-datasource",
  "uid": "testdata-demo",
  "access": "proxy",
  "isDefault": true
}'
Next, define and provision a comprehensive 4-panel monitoring dashboard (dashboard.json) featuring random-walk time series, live request rates, CPU utilization gauges, and CSV wave generators:
cat > dashboard.json <<'EOF'
{
  "overwrite": true,
  "folderUid": "",
  "dashboard": {
    "uid": "shortform-demo",
    "title": "Shortform Demo - Live Telemetry",
    "tags": ["demo"],
    "time": { "from": "now-6h", "to": "now" },
    "refresh": "10s",
    "schemaVersion": 39,
    "panels": [
      {
        "id": 1,
        "type": "timeseries",
        "title": "Live Telemetry - Random Walk",
        "gridPos": { "x": 0, "y": 0, "w": 16, "h": 10 },
        "datasource": { "type": "grafana-testdata-datasource", "uid": "testdata-demo" },
        "targets": [
          { "refId": "A", "scenarioId": "random_walk", "seriesCount": 3, "alias": "node-$seriesIndex" }
        ]
      },
      {
        "id": 2,
        "type": "stat",
        "title": "Requests / s",
        "gridPos": { "x": 16, "y": 0, "w": 8, "h": 5 },
        "datasource": { "type": "grafana-testdata-datasource", "uid": "testdata-demo" },
        "targets": [
          { "refId": "A", "scenarioId": "random_walk", "min": 200, "max": 900, "startValue": 500 }
        ]
      },
      {
        "id": 3,
        "type": "gauge",
        "title": "CPU %",
        "gridPos": { "x": 16, "y": 5, "w": 8, "h": 5 },
        "fieldConfig": { "defaults": { "min": 0, "max": 100, "unit": "percent" } },
        "datasource": { "type": "grafana-testdata-datasource", "uid": "testdata-demo" },
        "targets": [
          { "refId": "A", "scenarioId": "random_walk", "min": 20, "max": 95, "startValue": 55 }
        ]
      },
      {
        "id": 4,
        "type": "timeseries",
        "title": "Predictable CSV Wave",
        "gridPos": { "x": 0, "y": 10, "w": 24, "h": 8 },
        "datasource": { "type": "grafana-testdata-datasource", "uid": "testdata-demo" },
        "targets": [
          {
            "refId": "A",
            "scenarioId": "predictable_csv_wave",
            "csvWave": [ { "timeStep": 60, "valuesCSV": "0,0,2,2,1,1,3,3,2,2" } ]
          }
        ]
      }
    ]
  }
}
EOF

TAPI /api/dashboards/db -X POST -d @dashboard.json
Set the newly imported dashboard as the organization's default landing page:
TAPI /api/org/preferences -X PATCH -d '{"homeDashboardUID":"shortform-demo"}'---
Browser Setup
Once the deployment and seeding steps complete, access Grafana via your browser:
- Open your web browser and navigate to
http://localhost:3000. - Sign in as
adminwith the password you set in the bootstrap step, then open the Shortform Demo - Live Telemetry dashboard (/d/shortform-demo/shortform-demo-live-telemetry).
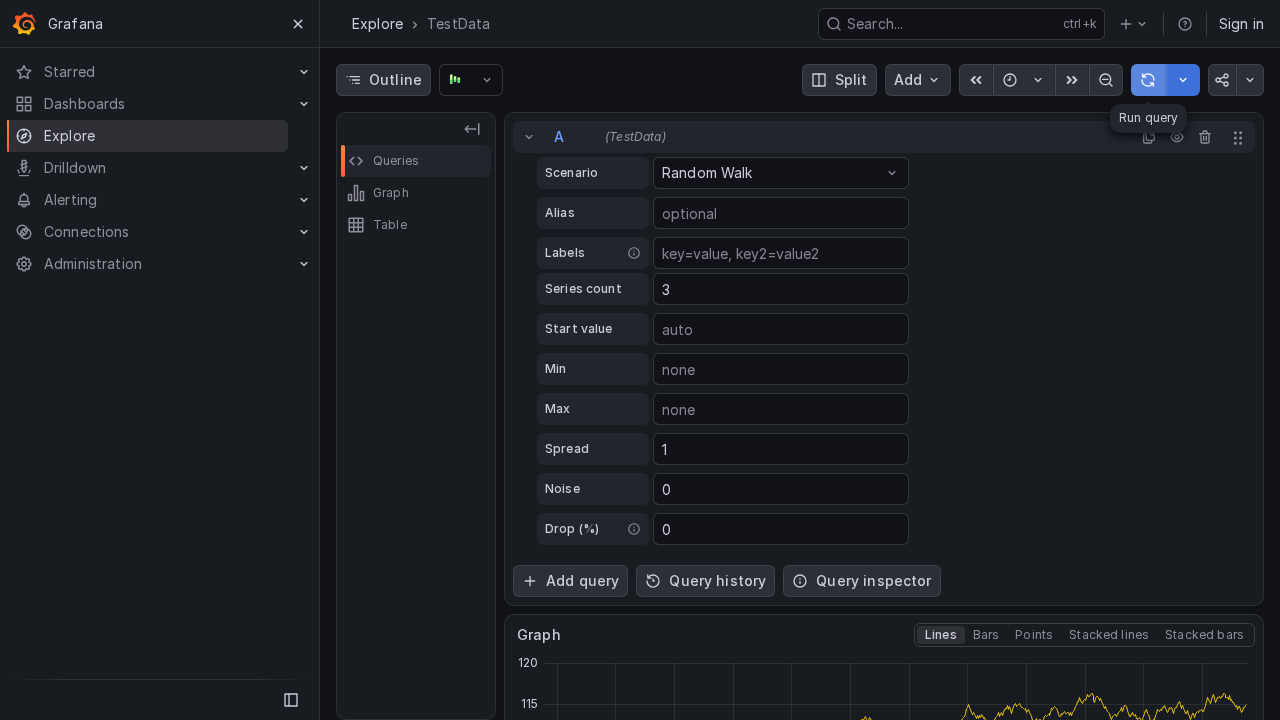
- Explore Mode: Navigate to the left navigation bar and click Explore (or visit
http://localhost:3000/explore). In the query inspector:
- Select datasource TestData (testdata-demo). - Select the scenario Random Walk. - Set Series count to 3. - Click Run query to visualize live mathematical series on an interactive canvas.
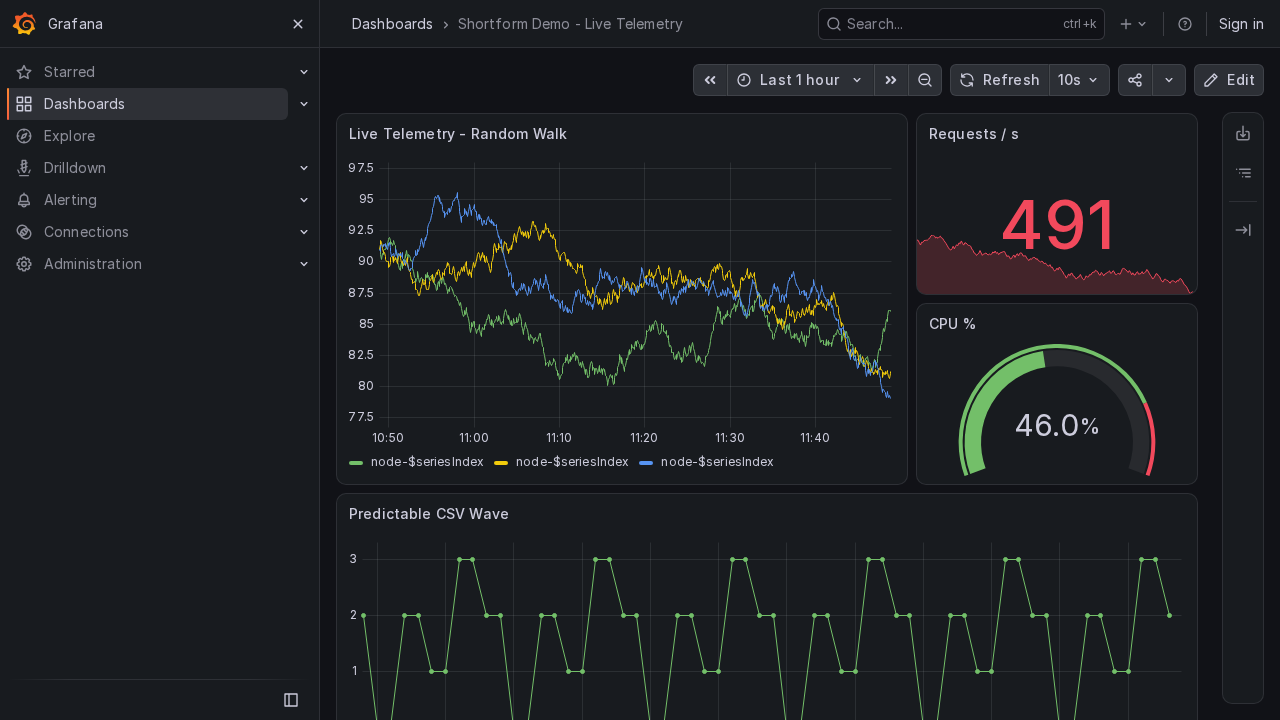
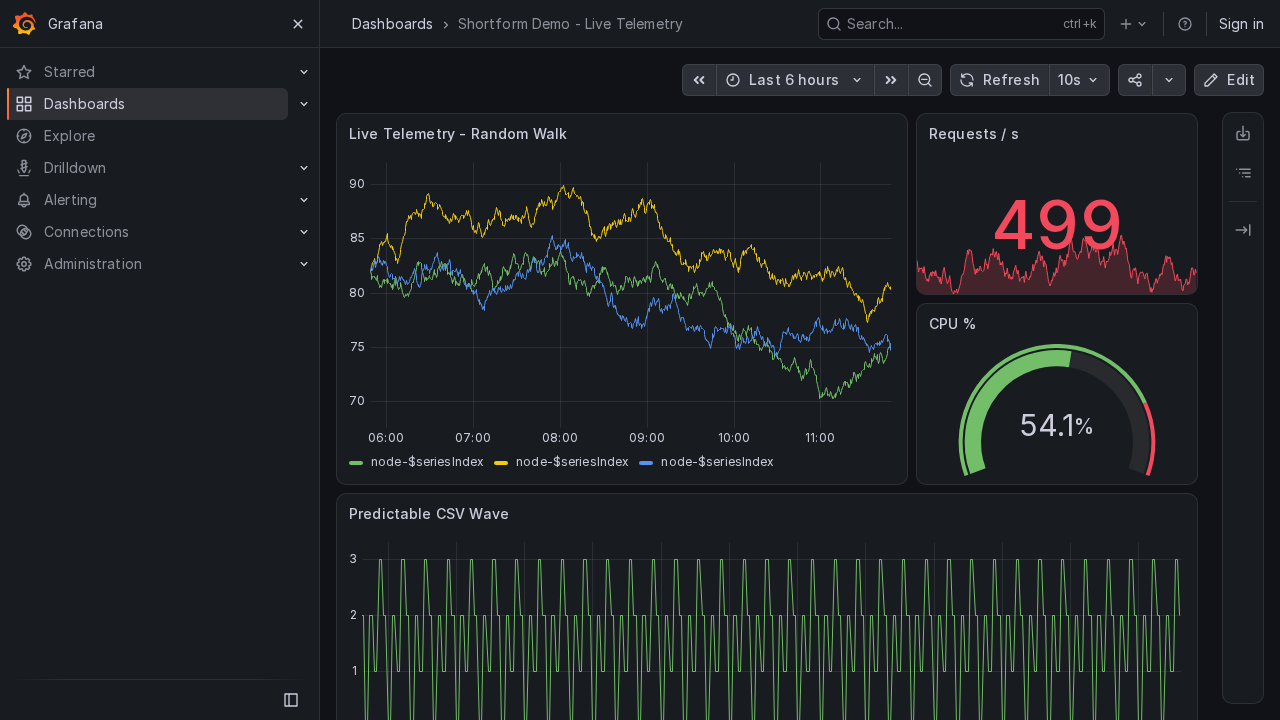
- Live Telemetry Dashboard: Return to the home dashboard to view all four real-time panels auto-refreshing every 10 seconds:
- Live Telemetry - Random Walk: A 3-series multi-color fluctuating line graph. - Requests / s: High-visibility stat card rendering instantaneous rates with historical sparklines. - CPU %: Color-graded radial gauge visualizing percent utilization thresholds. - Predictable CSV Wave: Standardized cyclic waveform demonstrating predictable pattern modeling.
---
Verification
Run these validation commands to verify container operations, API token functionality, data source health, and metric query execution.
1. Verify Container Health and Version
Query the unauthenticated /api/health endpoint:
curl -fsS http://localhost:3000/api/healthExpected output:
{"commit":"6f8ce3c6218fcebe2ea9edfe260c6d70ffb076ad","database":"ok","version":"13.3.0"}Confirm that the database status reports "ok" and the version confirms 13.3.0.
2. Verify Data Source Health Check
Validate that the provisioned TestData data source is responsive via the REST API:
TAPI /api/datasources/uid/testdata-demo/healthExpected output:
{
  "message": "Data source is working",
  "status": "OK"
}
3. Execute Live Metric Queries via Backend API
Issue an authenticated POST request against the unified query backend /api/ds/query over a 1-hour window:
TAPI /api/ds/query -X POST -d '{
  "from": "now-1h",
  "to": "now",
  "queries": [
    {
      "refId": "A",
      "datasource": { "uid": "testdata-demo" },
      "scenarioId": "random_walk"
    }
  ]
}' | python3 -c 'import sys, json; res = json.load(sys.stdin); vals = res["results"]["A"]["frames"][0]["data"]["values"][1]; print(f"Query successful: retrieved {len(vals)} telemetry data points. Last value: {round(vals[-1], 2)}")'
Expected output:
Query successful: retrieved 3600 telemetry data points. Last value: ...4. Verify Dashboard Registration
Search the Grafana dashboard catalog by tag to verify that the provisioned dashboard is indexed:
TAPI '/api/search?tag=demo'Expected output:
[
  {
    "id": 1,
    "uid": "shortform-demo",
    "title": "Shortform Demo - Live Telemetry",
    "uri": "db/shortform-demo-live-telemetry",
    "url": "/d/shortform-demo/shortform-demo-live-telemetry",
    "type": "dash-db",
    "tags": ["demo"],
    "isStarred": false
  }
]
5. Verify Running Container State
Inspect the container state with Docker Compose:
docker compose psVerify that container ${COMPOSE_PROJECT_NAME}-server displays state Up and status healthy.
---
Troubleshooting
The table below lists common deployment issues, root causes, and verified resolutions.
| Issue / Symptom | Possible Cause | Resolution |
|---|---|---|
Permission denied (open /var/lib/grafana/grafana.db: permission denied) | Persistent host directory ./data is not writable by container user grafana (UID 472) | Execute chmod 777 deploy/data or chown -R 472:472 deploy/data on the host, then run docker compose restart. |
Port collision error (bind: address already in use on port 3000) | Another service or container is already bound to host TCP port 3000 | Modify GRAFANA_PORT in .env to an alternate unused host port (e.g. 3002, 3003, or 8080) and restart with docker compose up -d. |
Default credentials rejected (HTTP 401 Unauthorized for admin / admin) | Grafana password was already rotated or changed via CLI bootstrap | Use the rotated password set via grafana cli admin reset-admin-password, or execute the CLI reset command again inside the container. |
| TestData data source missing in Grafana 13.x | TestData is no longer auto-provisioned by default in fresh Grafana 13 installations | Create the data source programmatically via POST /api/datasources with type grafana-testdata-datasource or mount a provisioning YAML file in /etc/grafana/provisioning/datasources/. |
Container health check failure (wget -q --spider http://localhost:3000/api/health) | Grafana container is still performing SQLite database schema migrations or port configuration is mismatched | Check startup logs with docker compose logs grafana. Allow up to 30 seconds for initial SQLite table creation. |
Timeseries panel legend displays literal string node-$seriesIndex | Grafana 13 TestData scenario does not interpolate $seriesIndex inside the alias attribute | Configure explicit series labels ("labels": "node=$seriesIndex") and reference them via standard field overrides (${__field.labels.node}). |
---
Assumptions & Decisions
- Version Pinning: Pinned to
grafana/grafana:13.3.0(commit6f8ce3c6218fcebe2ea9edfe260c6d70ffb076ad) rather than floatinglatest. This ensures deterministic reproducibility across environments and avoids breaking changes in plugins or APIs. - First-Run Owner Bootstrap: Grafana containers boot with default credentials
admin/admin. To enforce real-world security practices, the guide uses the containerized operator CLI (grafana cli admin reset-admin-password) to rotate the administrative password immediately, verifying that default credentials returnHTTP 401. - Automated API Access via Service Accounts: Demonstrates creating a dedicated Service Account (
shortform-bot) and scoped Bearer API token via REST API, avoiding hardcoded plaintext administrator passwords in automation scripts. - Anonymous access off: the published compose file sets
GF_AUTH_ANONYMOUS_ENABLED=false. The recorded sandbox temporarily turned on anonymous Admin only so the headless capture could skip the login form. - Zero Host Runtime Pollution: Grafana and its CLI run entirely inside Docker. No Go, Node.js, or pnpm packages are required on the host system.
- Synthetic Telemetry with TestData: Leverages the embedded TestData data source (
grafana-testdata-datasource) to deliver immediate, dynamic 4-panel dashboards (random walk, requests/sec, CPU gauge, CSV wave) without requiring external telemetry collectors or Prometheus exporters. - Storage File Permissions: Local directory
./datais mounted to/var/lib/grafanawithchmod 777permissions to allow the unprivileged container process (UID 472) full access to read and write the SQLite database.
Get the Unified Homelab Stack Compose Pack
One-command multi-container Compose files (Full *arr Stack, Prometheus + Grafana + ntfy Monitoring, and Homelab Auth) plus new verified deploys once a week.