How to Deploy Dozzle with Docker Compose: Real-Time Container Log Viewer
Dozzle provides a lightweight, real-time web viewer for Docker container logs with zero database overhead. Here is how to deploy it using Docker Compose, enable web terminal access, and monitor streaming logs.
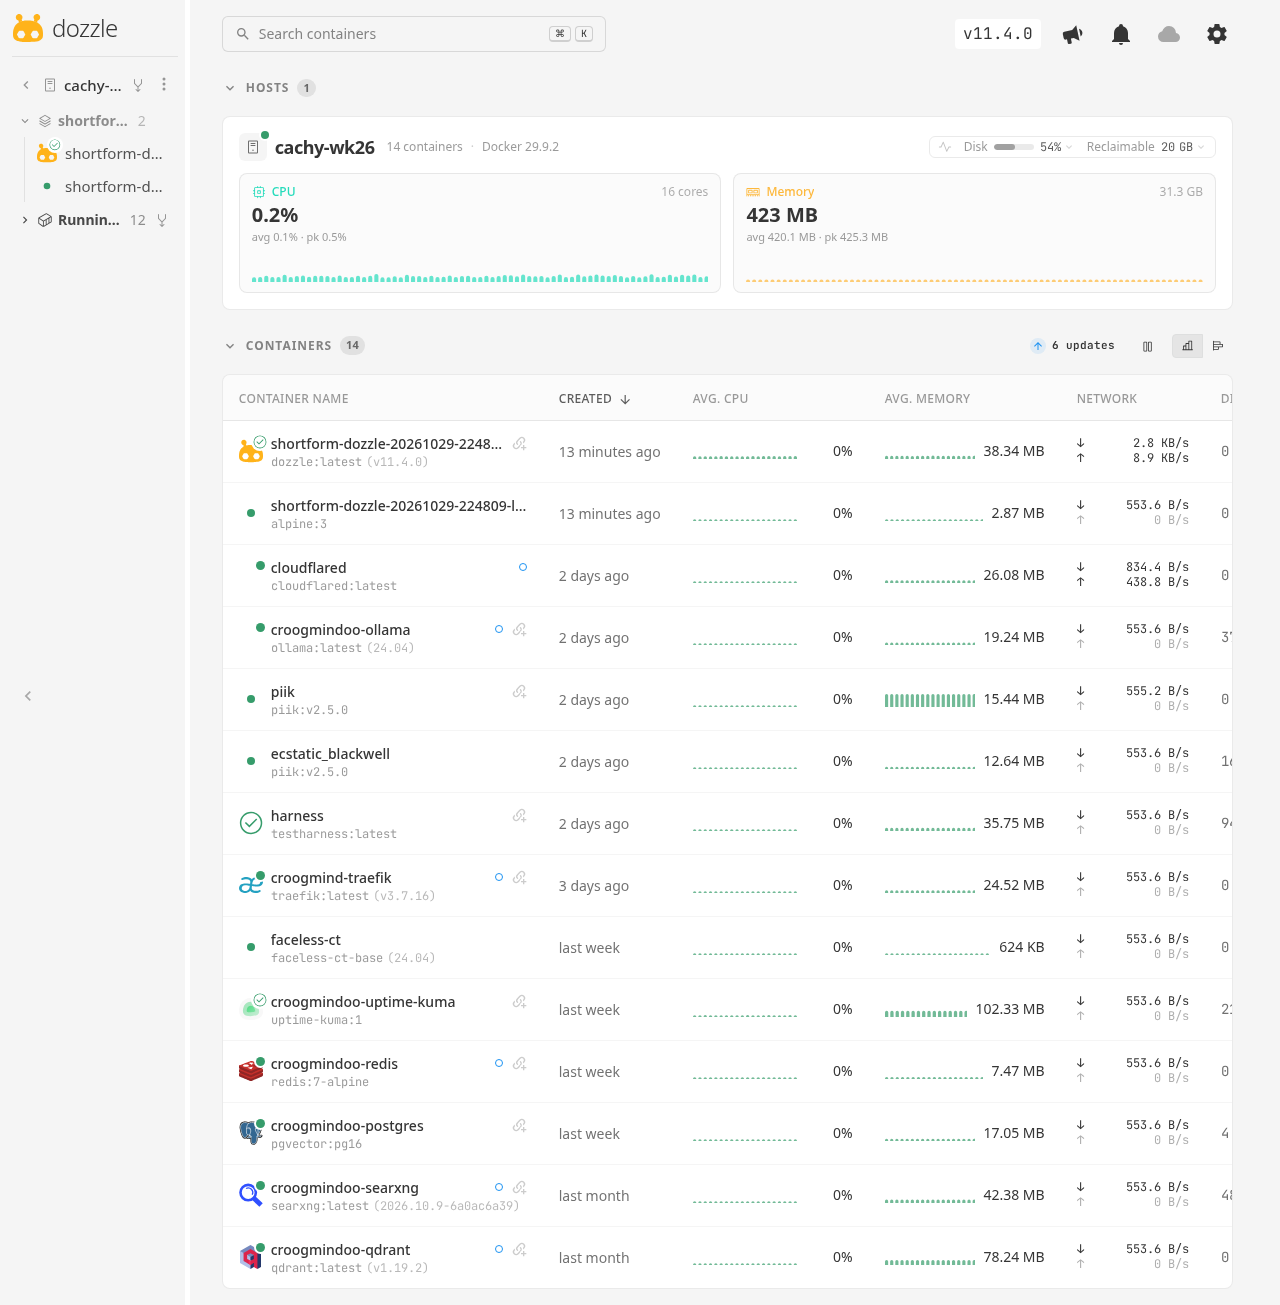
Dozzle is an open-source, lightweight log viewer and resource monitor for Docker containers. Written in Go with a responsive web frontend, Dozzle does not store log data or require an external database. Instead, it reads container logs and metrics directly from the Docker Unix socket over Server-Sent Events (SSE), keeping host resource overhead minimal (~7 MB static binary image).
This guide walks through deploying Dozzle v11.4.0 using Docker Compose, configuring container controls, accessing the built-in web terminal, and navigating multi-container split views.
Prerequisites
Before starting, ensure your host environment meets the following requirements:
- Docker Engine: Installed and running with Docker Compose v2 support (
docker compose version). Tested with Docker Compose 5.6.1. - Docker Unix Socket Access: Read permissions on
/var/run/docker.sock. - Available Host Port: Port
3000(or8080) free for loopback binding. - Modern Web Browser: For accessing the web dashboard over HTTP.
Exact Install Steps
Follow these sequential steps to deploy Dozzle alongside a lightweight log generator container for testing.
1. Create Deployment Directory
Create a dedicated directory for your Dozzle configuration files:
mkdir -p dozzle-deploy
cd dozzle-deploy
2. Create the Docker Compose Manifest
Create a docker-compose.yml file. This manifest deploys Dozzle with shell access and container action controls enabled, while mounting the Docker socket in read-only mode (:ro):
services:
  dozzle:
    image: amir20/dozzle:latest
    container_name: dozzle
    ports:
      - "127.0.0.1:3000:8080"
    volumes:
      - /var/run/docker.sock:/var/run/docker.sock:ro
      - dozzle_data:/data
    environment:
      - DOZZLE_DISABLE_SETUP_WIZARD=true
      - DOZZLE_ENABLE_ACTIONS=true
      - DOZZLE_ENABLE_SHELL=true
      - DOZZLE_NO_ANALYTICS=true
      - DOZZLE_LEVEL=info
    healthcheck:
      test: ["CMD", "/dozzle", "healthcheck"]
      interval: 3s
      timeout: 3s
      retries: 5
      start_period: 2s
    restart: unless-stopped

  # Companion container emitting steady synthetic log output for verification
  log-generator:
    image: alpine:3
    container_name: dozzle-logger
    command:
      - sh
      - -c
      - 'i=0; while true; do i=$$((i+1)); echo "$$(date -Iseconds) [INFO] api-worker-$$((i % 3 + 1)): processed event #$$i status=ok latency=$$((RANDOM % 40 + 10))ms"; sleep 1; done'
    restart: unless-stopped

volumes:
  dozzle_data:
Note on Environment Options:
-DOZZLE_DISABLE_SETUP_WIZARD=true: Skips the initial onboarding prompt.
-DOZZLE_ENABLE_ACTIONS=true: Enables container start, stop, and restart controls in the UI.
-DOZZLE_ENABLE_SHELL=true: Enables in-browser interactive terminal sessions (xterm.js).
-DOZZLE_FILTER: Optional filter string (for example,label=com.docker.compose.project=myproject) to scope Dozzle's view to specific containers only.
- Double dollar signs ($$) in the companion container command prevent Docker Compose from attempting variable interpolation on runtime shell expressions.
3. Pull the Images
Fetch the prebuilt container images:
docker compose pull4. Start the Application
Launch the containers in detached mode:
docker compose up -dConfirm that both services start cleanly:
docker compose psExpected output:
NAME            IMAGE                  COMMAND                  SERVICE         CREATED         STATUS                   PORTS
dozzle          amir20/dozzle:latest   "/dozzle"                dozzle          5 seconds ago   Up 4 seconds (healthy)   127.0.0.1:3000->8080/tcp
dozzle-logger   alpine:3               "sh -c 'i=0; while t…"   log-generator   5 seconds ago   Up 4 seconds
Verification
Verify container health and connectivity prior to opening the web browser:
- HTTP Healthcheck: Query the built-in health check endpoint:
``sh curl -fsS -o /dev/null -w '%{http_code}\n' http://localhost:3000/healthcheck ` Expected response: 200`.
- Dozzle Service Logs: Check the initial startup logs for engine connection confirmation:
``sh docker compose logs --tail 10 dozzle ` Look for lines confirming connection to Docker and HTTP server initialization: `json {"level":"info","version":"v11.4.0","message":"Dozzle version v11.4.0"} {"level":"info","clients":1,"message":"Connected to Docker"} {"level":"info","message":"Accepting connections on :8080"} ``
- Log Stream Activity: Verify the companion container is streaming events:
``sh docker compose logs --tail 3 log-generator ``
Browser Setup & Navigation
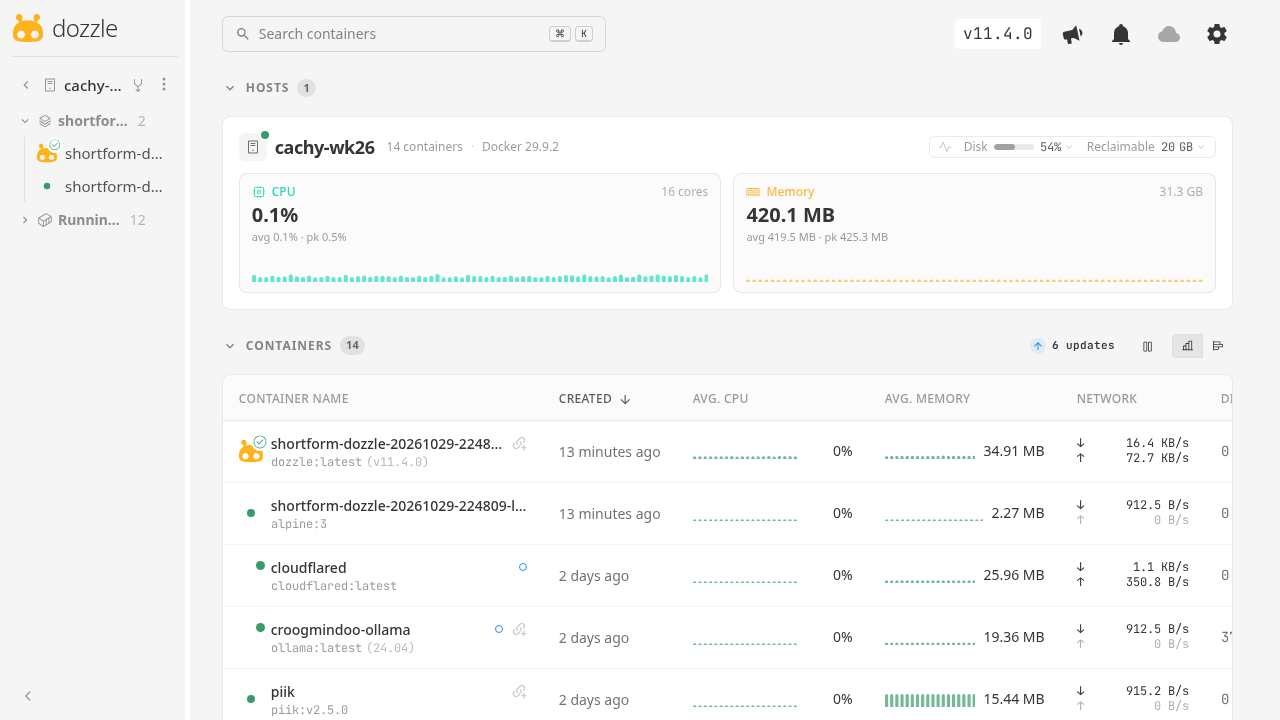
Open http://localhost:3000/ in your browser. Dozzle opens directly into the host overview dashboard.
1. Host Dashboard & Resource Meters
The primary dashboard displays real-time CPU and memory meters for the host along with a tabular listing of all running containers, including live CPU percentages, memory allocations, and network throughput counters.
2. Fast Container Search (Ctrl+K)
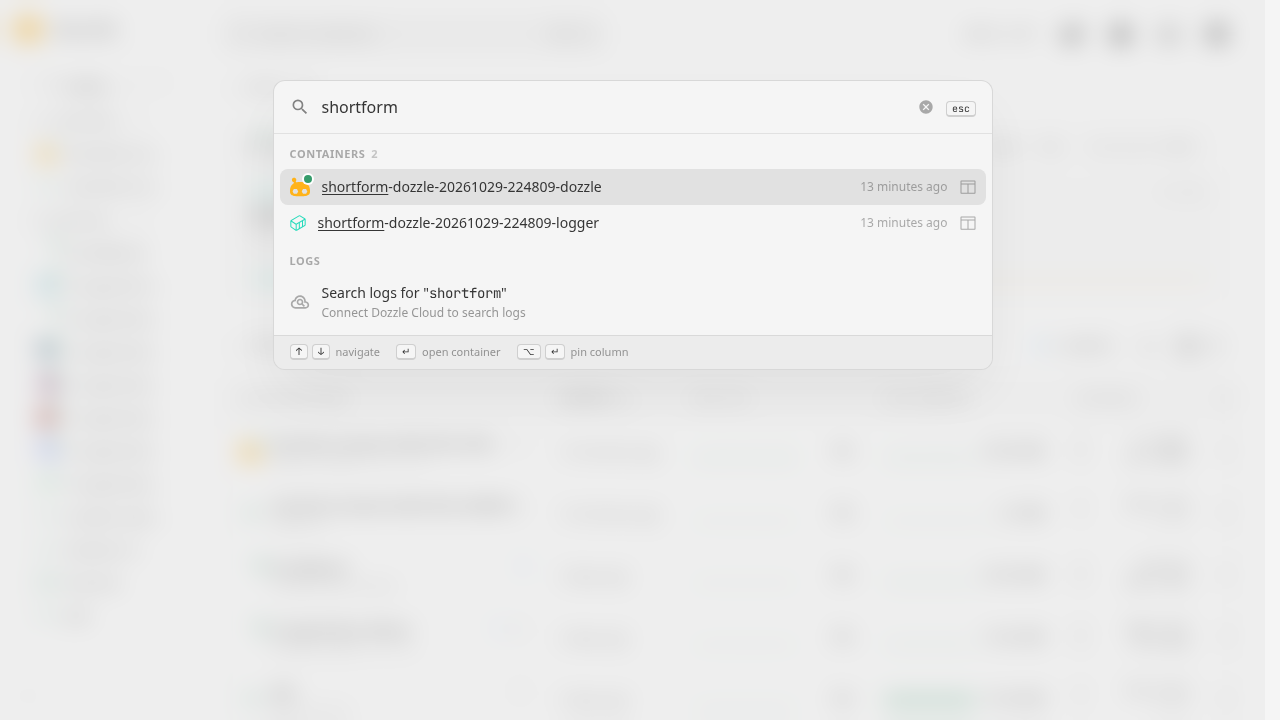
Press Ctrl+K (or click the search box in the header) to open the fuzzy search palette. Type the name or prefix of any container to filter the list and press Enter to navigate directly to its log stream.
3. Real-Time Streaming Logs
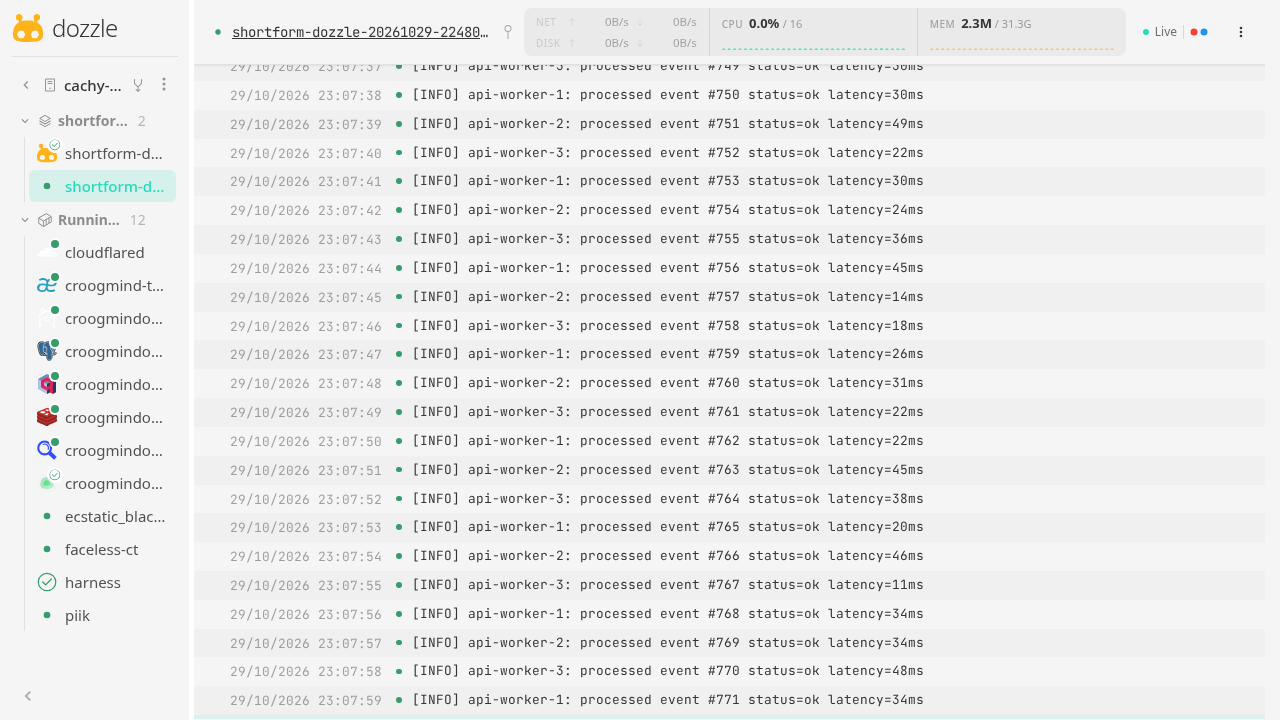
Selecting a container opens its dedicated live log console. New log lines arrive in real time over Server-Sent Events with timestamps and severity badges. Auto-scroll keeps the view locked to the latest output.
4. In-Stream Searching (Ctrl+F)
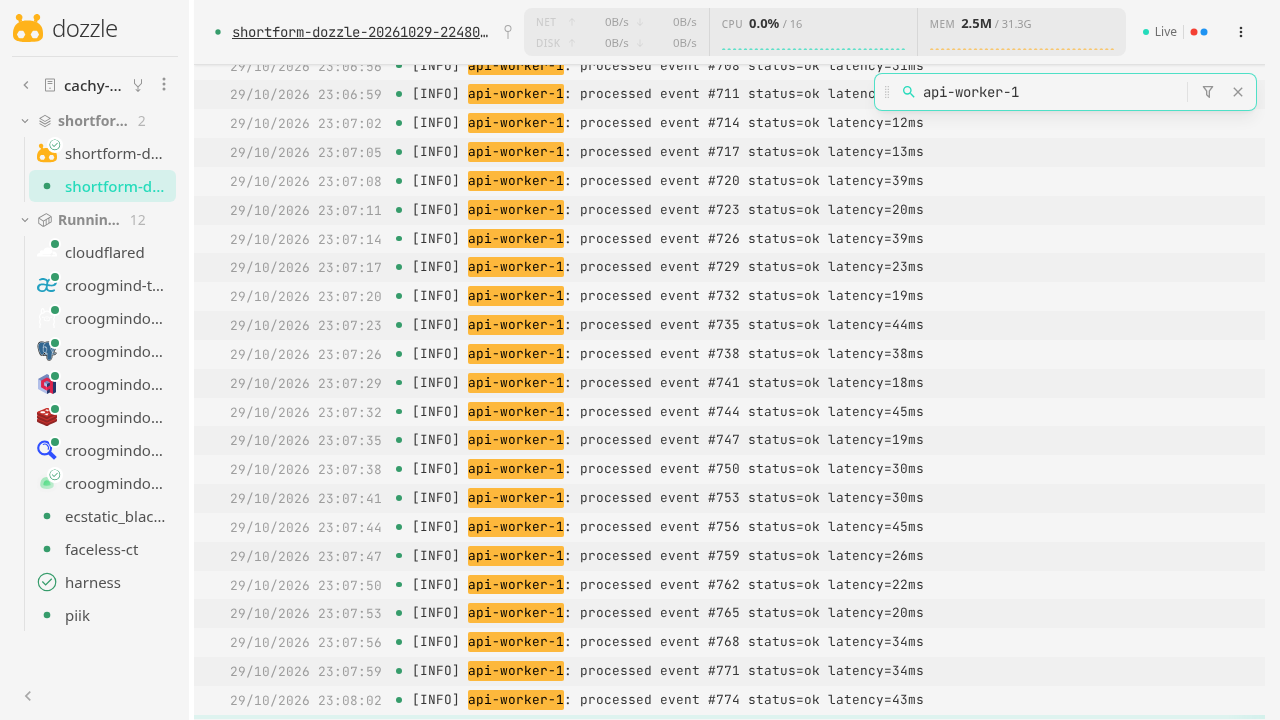
Press Ctrl+F while viewing any log stream to open the in-line filter bar. Type a substring or regex (e.g., api-worker-1). Matching entries highlight instantly in high-contrast orange without pausing or reloading the stream.
5. Time Window & Stream Filters
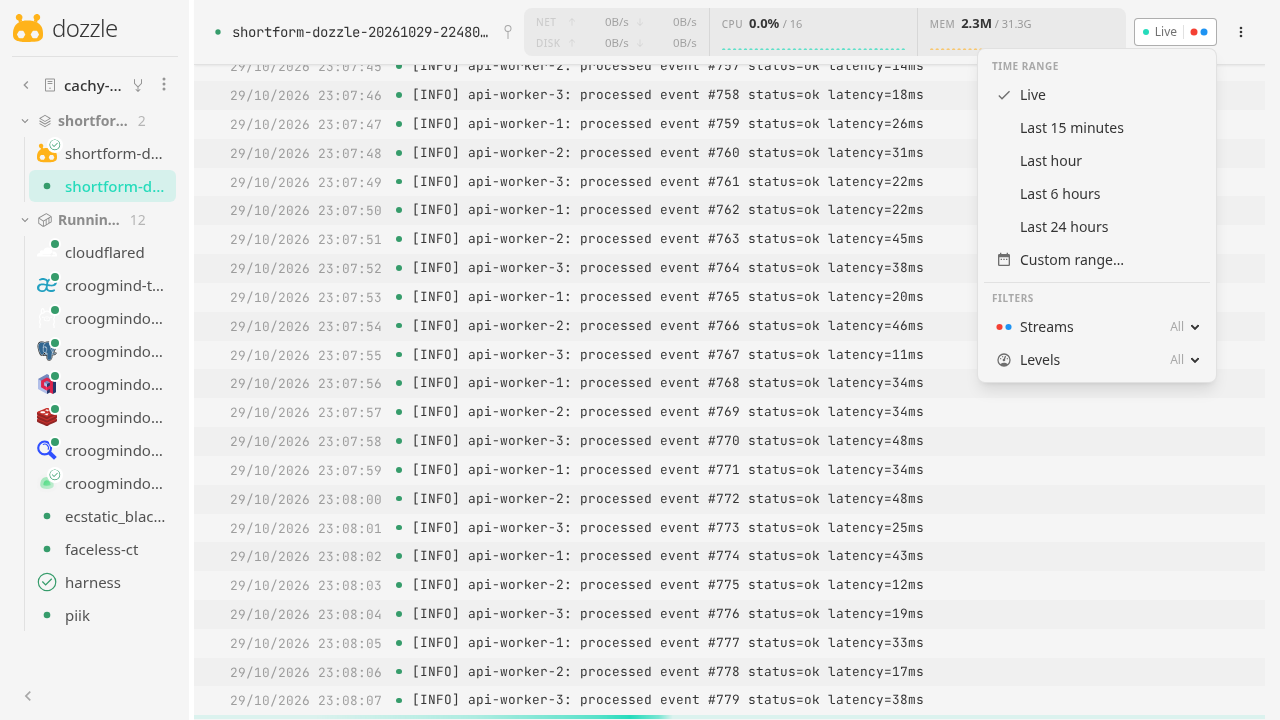
Use the filter toolbar above the log output to restrict the visible time range (Live, 15m, 1h, 6h, 24h, or Custom). You can also toggle between stdout and stderr streams, or filter by standard log levels.
6. Merged Multi-Container Stream
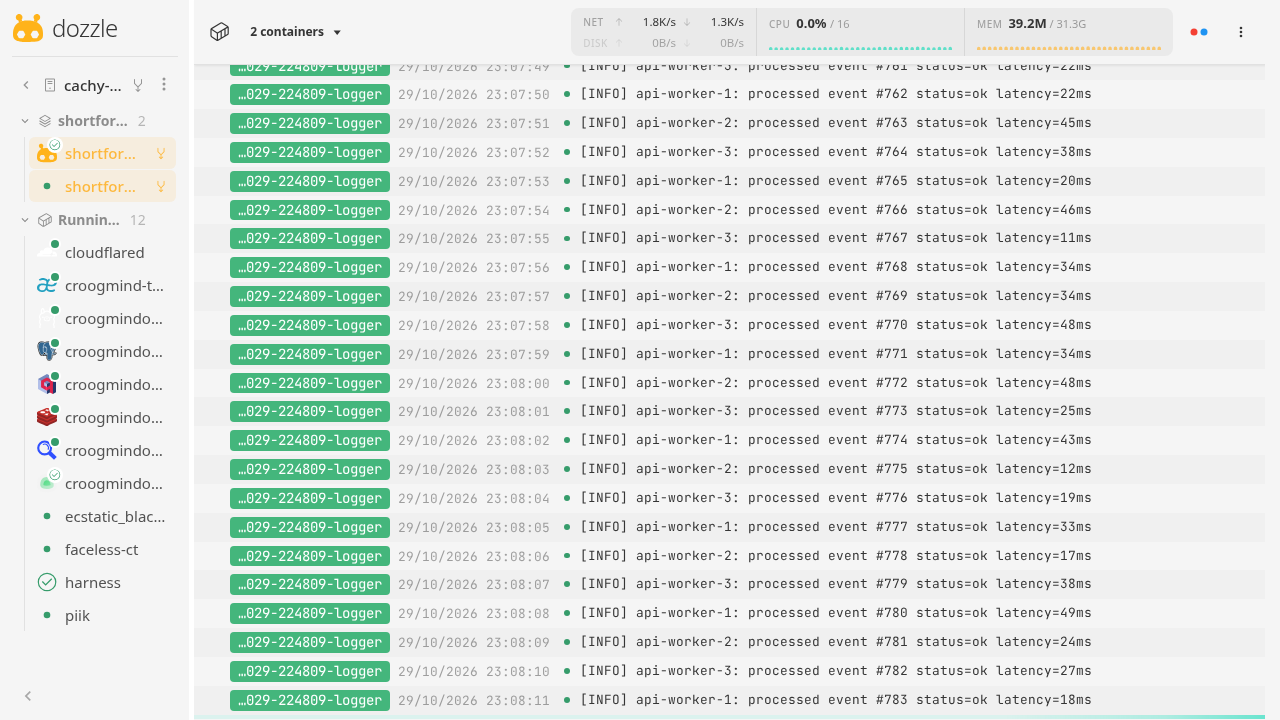
To monitor interdependent services simultaneously, navigate to /merged/<container1>,<container2> or select multiple containers in the sidebar. Dozzle interleaves their logs into a single unified timeline, color-coding lines by container name.
7. Pinned Side-by-Side Split View
Press Alt+Enter on any container in the search palette to pin it alongside your active stream. This provides synchronized side-by-side terminal columns for cross-referencing logs across separate microservices.
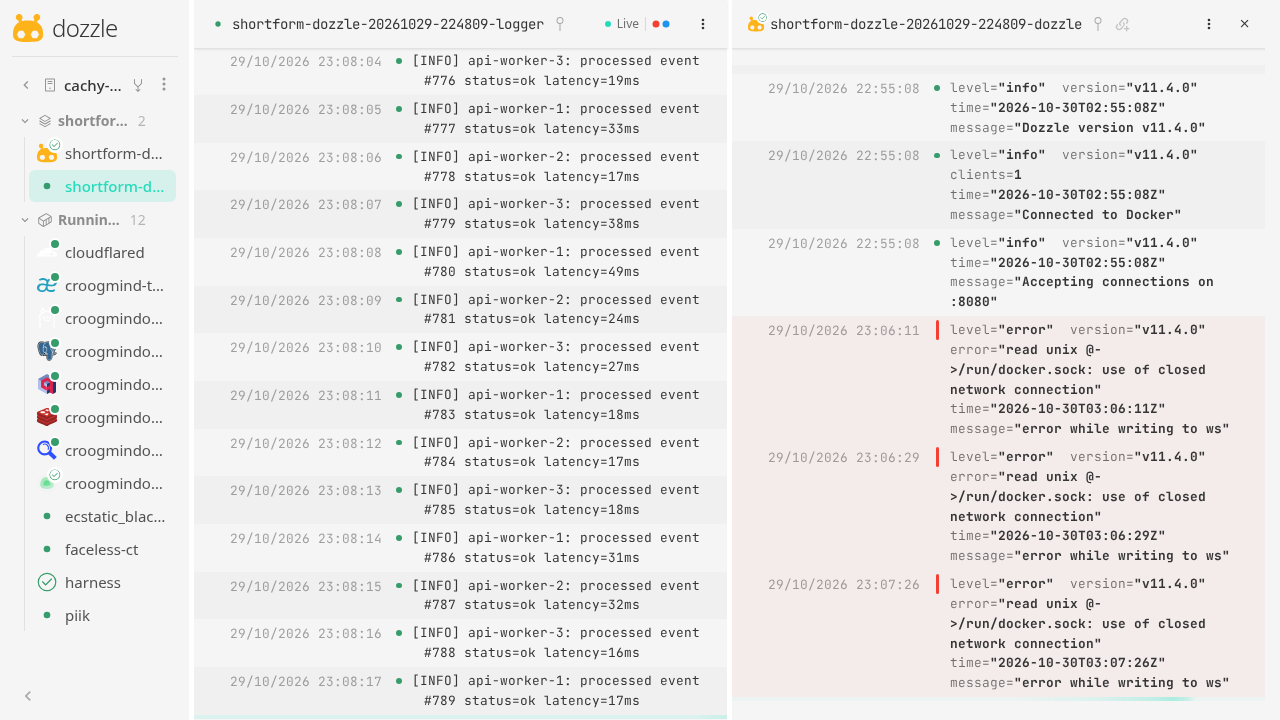
8. In-Browser Interactive Terminal
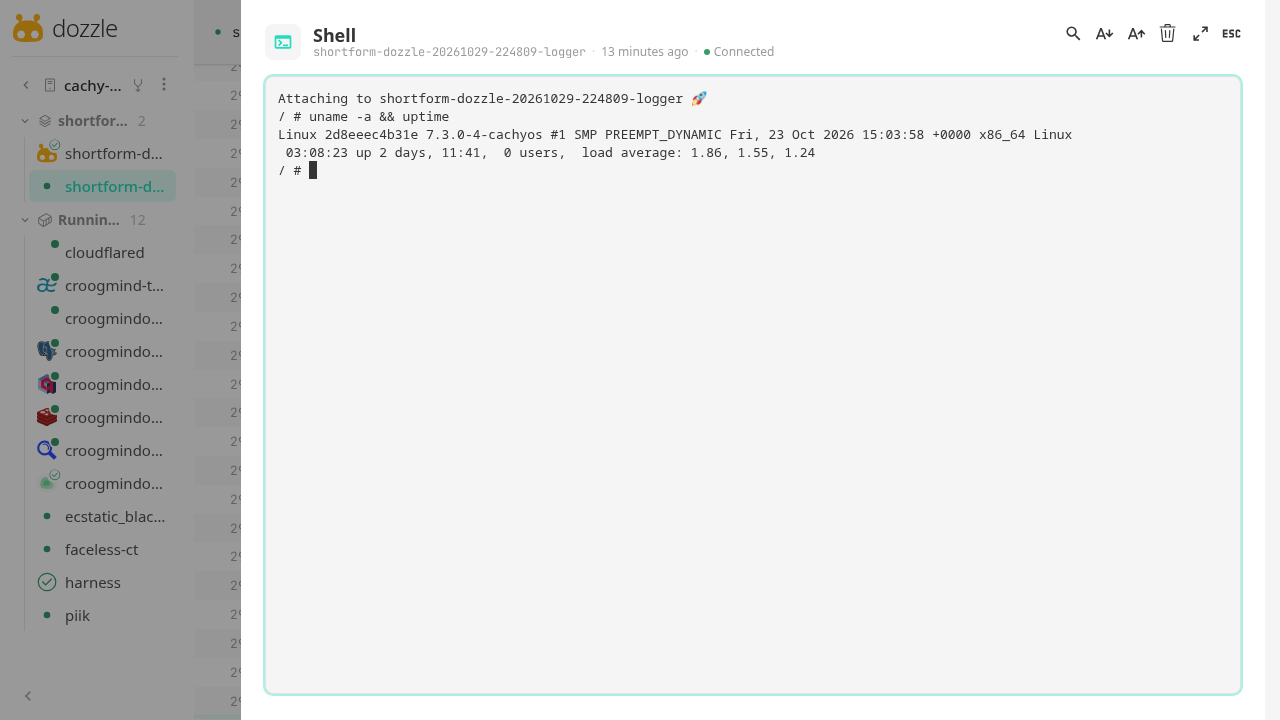
With DOZZLE_ENABLE_SHELL=true, click the terminal icon in the upper-right corner of a container view to attach an interactive xterm.js web shell directly inside the running container.
9. Preferences and Customization
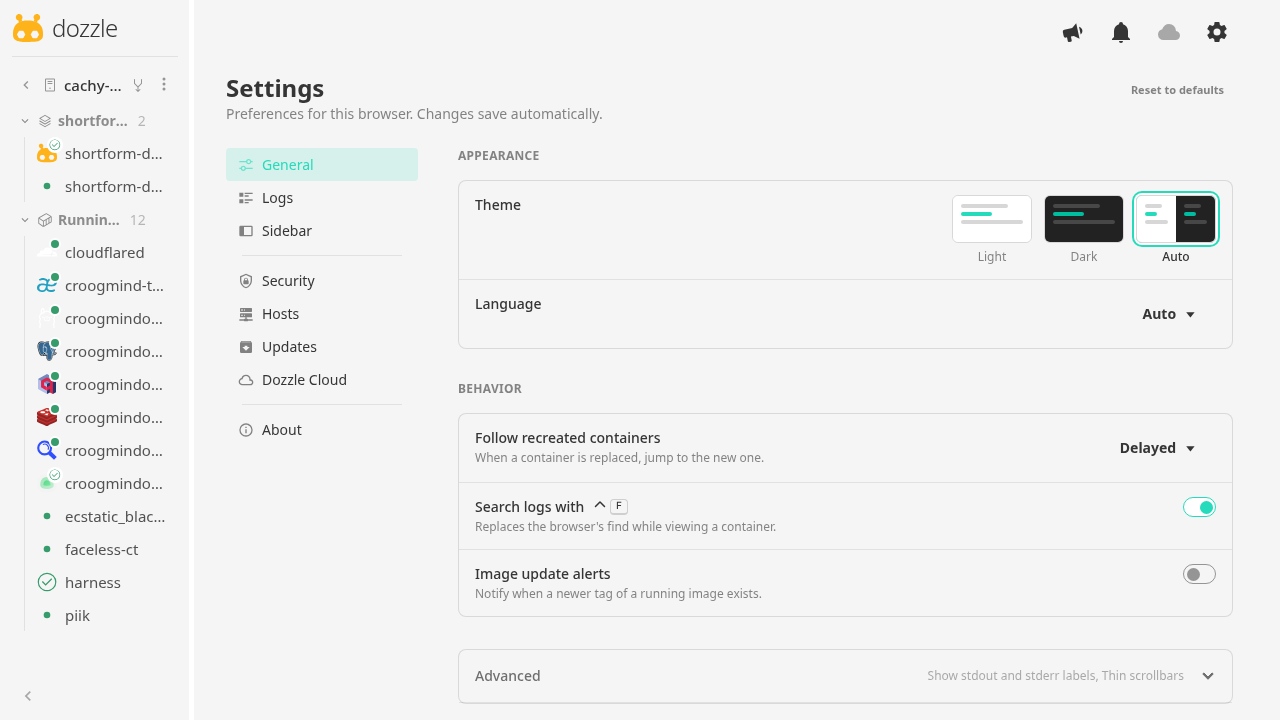
Click the settings gear icon in the lower-left navigation bar to configure appearance settings, toggle light or dark themes, adjust console font sizes, and manage keyboard shortcuts.
Troubleshooting
| Symptom | Cause | Resolution |
|---|---|---|
Cannot connect to Docker daemon | Socket not mounted or permissions missing | Ensure /var/run/docker.sock is mounted as :ro and that the host user running Docker has socket access permissions. |
port is already allocated: 0.0.0.0:3000 | Host port conflict | Change the host port mapping in docker-compose.yml (e.g. 127.0.0.1:3002:8080) and restart with docker compose up -d. |
| Setup Wizard modal blocks the interface | Missing onboarding bypass variable | Add DOZZLE_DISABLE_SETUP_WIZARD=true under the environment section of docker-compose.yml. |
| Terminal and action controls are grayed out | Actions disabled by default | Set DOZZLE_ENABLE_ACTIONS=true and DOZZLE_ENABLE_SHELL=true in environment. |
| Unrelated host containers appear in sidebar | Default unfiltered socket access | Add DOZZLE_FILTER=label=com.docker.compose.project=<project> or label filters to restrict container discovery. |
| Bash syntax error in log generator container | Compose unescaped shell expressions | Use double dollar signs ($$((i+1)) and $$(date)) in compose command strings to prevent compose variable interpolation. |
Teardown
To shut down and remove the deployed Dozzle containers, networks, and volumes:
docker compose down -vAssumptions & Decisions
- Prebuilt Image Deployment: The guide uses the official multi-arch Docker image
amir20/dozzle:latest(v11.4.0) rather than building from source. The binary scratch container requires zero compiler dependencies and downloads in seconds. - Loopback Binding: Bound host port
3000to127.0.0.1(127.0.0.1:3000:8080) to prevent accidental external exposure while keeping the port distinct from default port 8080. - Companion Log Container: Included a lightweight
alpine:3log generator in the Compose file to provide immediate live streaming activity during verification and browser walkthroughs. - Container Scoping: Documented
DOZZLE_FILTERas an optional configuration to help users isolate their own containers when running on shared Docker hosts. - Markdown Pipe Table: Formatted the troubleshooting section as a standard GitHub-flavored Markdown table so
ghost-draftparses and converts it directly into a Ghost HTML card.
Get the Unified Homelab Stack Compose Pack
One-command multi-container Compose files (Full *arr Stack, Prometheus + Grafana + ntfy Monitoring, and Homelab Auth) plus new verified deploys once a week.